Post is sponsored by Solidigm.
Today, more data is being created, stored and analyzed than ever before. As workloads become more read-intensive, many storage architects are taking notice of the benefits quad-level cell (QLC) solid-state drives (SSDs) offer when it comes to both capacity and performance. But another critical factor is the benefits these SSDs can deliver to a company’s bottom line. QLC offers a combination of cost, capacity and performance that can make them an attractive replacement for both hard disk drives (HDDs) and triple-level cell (TLC) SSDs.
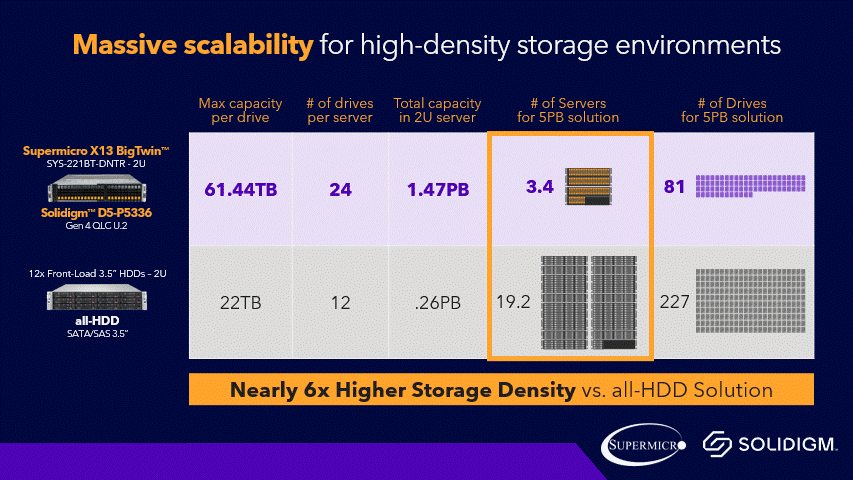
Modern QLC SSDs expand data capacity and provide greater density, which enables more capacity in the same space for a lower cost per gigabyte. QLC drives offer the ability to store massive data sets efficiently – up to 6X more data than HDDs and 2X more data than TLC SSDs. These QLC SSDs deliver huge capacities in a small form factor as well.
When you look at cost per gigabyte, QLCs offer an advantage over TLCs in large capacities, and while they do not cost less than HDDs, QLCs are competitive. Solidigm asserts that deploying QLC SSDs storage architects can save up to 61% total solution cost compared to using a hybrid (HDD+TLC) storage array.

Scalability for high-density storage environments
By filling 2 petabytes of storage in 1U rack, advanced QLC SSDs can, when compared to HDDs in a 2U rack:
- Save up to 11.8x more rack space.1
- Reduce power costs on average by 4.9X.2
And when compared to TLC SSDs, QLC SSDs can:
- Store up to 4X more capacity in a 2U chasis vs TLC SSDs.
- Reduce cost by 61% compared to hybrid HDDs + TLC storage arrays.3
AI, ML and beyond
Artificial intelligence (AI), machine learning (ML), content delivery networks, scale-out network attached storage (NAS) and object storage are all read-intensive workloads that continue to drive enormous volumes of data, regardless of where they reside. While these workloads are predominantly read intensive – where a high-density, high-capacity SSD comes into play – there is also a growing need for faster performance when data is pulled from a drive.
“Modern workloads like AI and capabilities like 5G are rapidly reshaping the storage landscape,” said Greg Matson, Solidigm’s vice president of strategy and marketing. Businesses need storage in more places that are inexpensive, able to store massive data sets efficiently, and access the data at speed.
When looking at total cost of ownership (TCO), QLC SSDs outshine HDDs and TLC when studied over a five-year period. QLC SSDs can reduce TCO by 17% over five years compared to all-TLC SSDs storage arrays, and that number jumps to 47% compared to all-HDD storage arrays.
Meet the Solidigm D5-P5336
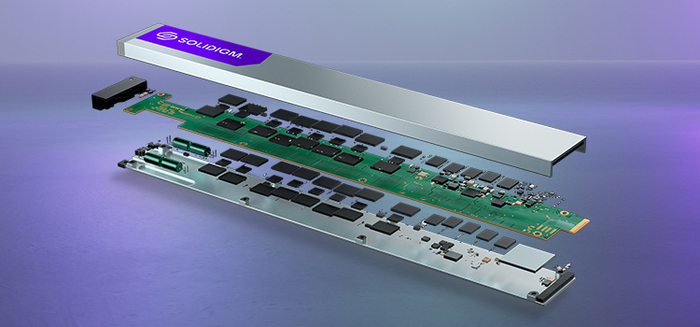
Solidigm is leading the charge to advance the QLC SSD market with the introduction of the D5-P5336, offered in capacities from 7.68TB to 61.44TB, the drive can store up to 6.1X more data in the same space compared to an all HDD array. The D5-P5336 is the highest capacity PCIe SSD for massive data storage from core to edge. The read performance of the D5-P5336 exceeds some of the latest cost-optimized TLC SSDs by 17%, per Solidigm data.
Initially, this new SSD is rolling out in E1.L form factor with up to 30.72TB, with subsequent availability extending to 61.44TB in both U.2 and E1.L. later in 2023.
One of the main constraints for edge workloads is the limitation of bandwidth rather than latency. “Solidigm’s D5-P5336 QLC SSDs offer an impressive combination of capacity, performance, and reliability as a solution to overcome this challenge,” said Doug Emby, vice president of sales and business development at Cheetah RAID Storage.
Conclusion
While QLC SSDs are often positioned as a value media, these SSDs go beyond just value-based storage. They offer unmatched density, competitive price and sustained performance, putting them in contention with HDDs and even TLC in certain applications.
About Solidigm: Solidigm is a leading global provider of innovative NAND flash memory solutions. Solidigm technology unlocks data’s unlimited potential for customers, enabling them to fuel human advancement. Originating from the sale of Intel’s NAND and SSD business, Solidigm became a standalone U.S. subsidiary of semiconductor leader SK hynix in December 2021. Headquartered in Rancho Cordova, California, Solidigm is powered by the inventiveness of more than 2,000 employees in 13 locations worldwide. For more information, please visit solidigm.com and follow us on Twitter and LinkedIn. “Solidigm” is a trademark of SK hynix NAND Product Solutions Corp. (d/b/a Solidigm).
Read more about QLC SSDs
- What you think you know about QLC SSDs might cost you
- Finding the sweet spot for QLC SSDs
- Solidigm and Supermicro execs discuss SSD density
1Claim: Analysis based on 100PB object storage solution deployment. Solution parameters: 42U rack capacity, 34U available for storage, 2U servers @ 12x 3.5” HDDs and 24x P5336 drives per server. Max 2U bays based on HPE Proliant DL385 Gen 11 configuration. Calculated duty cycles to deliver equivalent throughput per TB: 20% for HDD array, 8.9% for all-QLC solution. RAID 1 mirroring used for QLC; HDD set for Hadoop triplication. D5-P5336 configuration: 61.44TB, U.2, 7000 MB/s throughput, 25W average active write power, 5W idle power. Total racks = 9. All-HDD configuration: Seagate EXOS X20 18TB 3.5” SAS HDD ST120000NM002D (datasheet), 70% short- stroked throughput calculated to 500 MB/s; 9.4W average active power, 5.4W idle power. 5-year energy cost = $1.19M. Total racks = 106. Max 2U 3.5” bays based on Supermicro 2U SuperServer design. Common solution attributes: Power Cost = $0.15/KWHr; PUE factor = 1.60; Empty Rack Purchase Cost = $1,200; System Cost = $10,000; Rack Cost for Deployment Term = $171,200. Calculations based on Solidigm TCO estimations as of March 2023. See details in appendix. TCO calculations based on internal Solidigm TCO estimator tool.
2Claim: Analysis based on 100PB object storage solution deployment. Solution parameters: 42U rack capacity, 34U available for storage, 2U servers @ 12x 3.5” HDDs and 24x P5336 drives per server. Max 2U bays based on HPE Proliant DL385 Gen 11 configuration. Calculated duty cycles to deliver equivalent throughput per TB: 20% for HDD array, 8.9% for all-QLC solution. RAID 1 mirroring used for QLC; HDD set for Hadoop triplication. D5-P5336 configuration: 61.44TB, U.2, 7000 MB/s throughput, 25W average active write power, 5W idle power. 5-year energy cost = $244K. All-HDD configuration: Seagate EXOS X20 18TB 3.5” SAS HDD ST120000NM002D (datasheet), 70% short-stroked throughput calculated to 500 MB/s; 9.4W average active power, 5.4W idle power. 5-year energy cost = $1.19M. Max 2U 3.5” bays based on Supermicro 2U SuperServer design. Common solution attributes: Power Cost = $0.15/KWHr; PUE factor = 1.60; Empty Rack Purchase Cost = $1,200; System Cost = $10,000; Rack Cost for Deployment Term = $171,200. Calculations based on Solidigm TCO estimations as of March 2023. See details in appendix. TCO calculations based on internal Solidigm TCO estimator tool.
3Claim: Analysis based on 100PB object storage solution deployment. Solution parameters: 42U rack capacity, 34U available for storage, 2U servers @ 10x 3.5” HDDs + 2x 15.36TB TLC SSD vs. 24x P5336 drives per server. Max 2U bays based on HPE Proliant DL385 Gen 11 configuration. Calculated duty cycles to deliver equivalent throughput per TB: 20% for HDD array, 8.9% for all-QLC solution. RAID 1 mirroring used for QLC; Hybrid set for Hadoop triplication. D5-P5336 configuration: 61.44TB, U.2, 7000 MB/s throughput, 25W average active write power, 5W idle power. Hybrid configuration: Capacity – Seagate EXOS X20 18TB 3.5” SAS HDD ST120000NM002D (datasheet), 70% short-stroked throughput calculated to 500 MB/s; 9.4W average active power, 5.4W idle power. Max 2U 3.5” bays based on Supermicro 2U SuperServer design. Cache – Micron 7450 15.36TB, 6800 MB/s throughput, 16.6W average active write power, 5W idle power. Common solution attributes: Power Cost = $0.15/KWHr; PUE factor = 1.60; Empty Rack Purchase Cost = $1,200; System Cost = $10,000; Rack Cost for Deployment Term = $171,200. Calculations based on Solidigm TCO estimations as of March 2023. See details in appendix. TCO calculations based on internal Solidigm TCO estimator tool.
